First couple screenshots. A picture is worth a thousand words!-) Click images to enlarge:
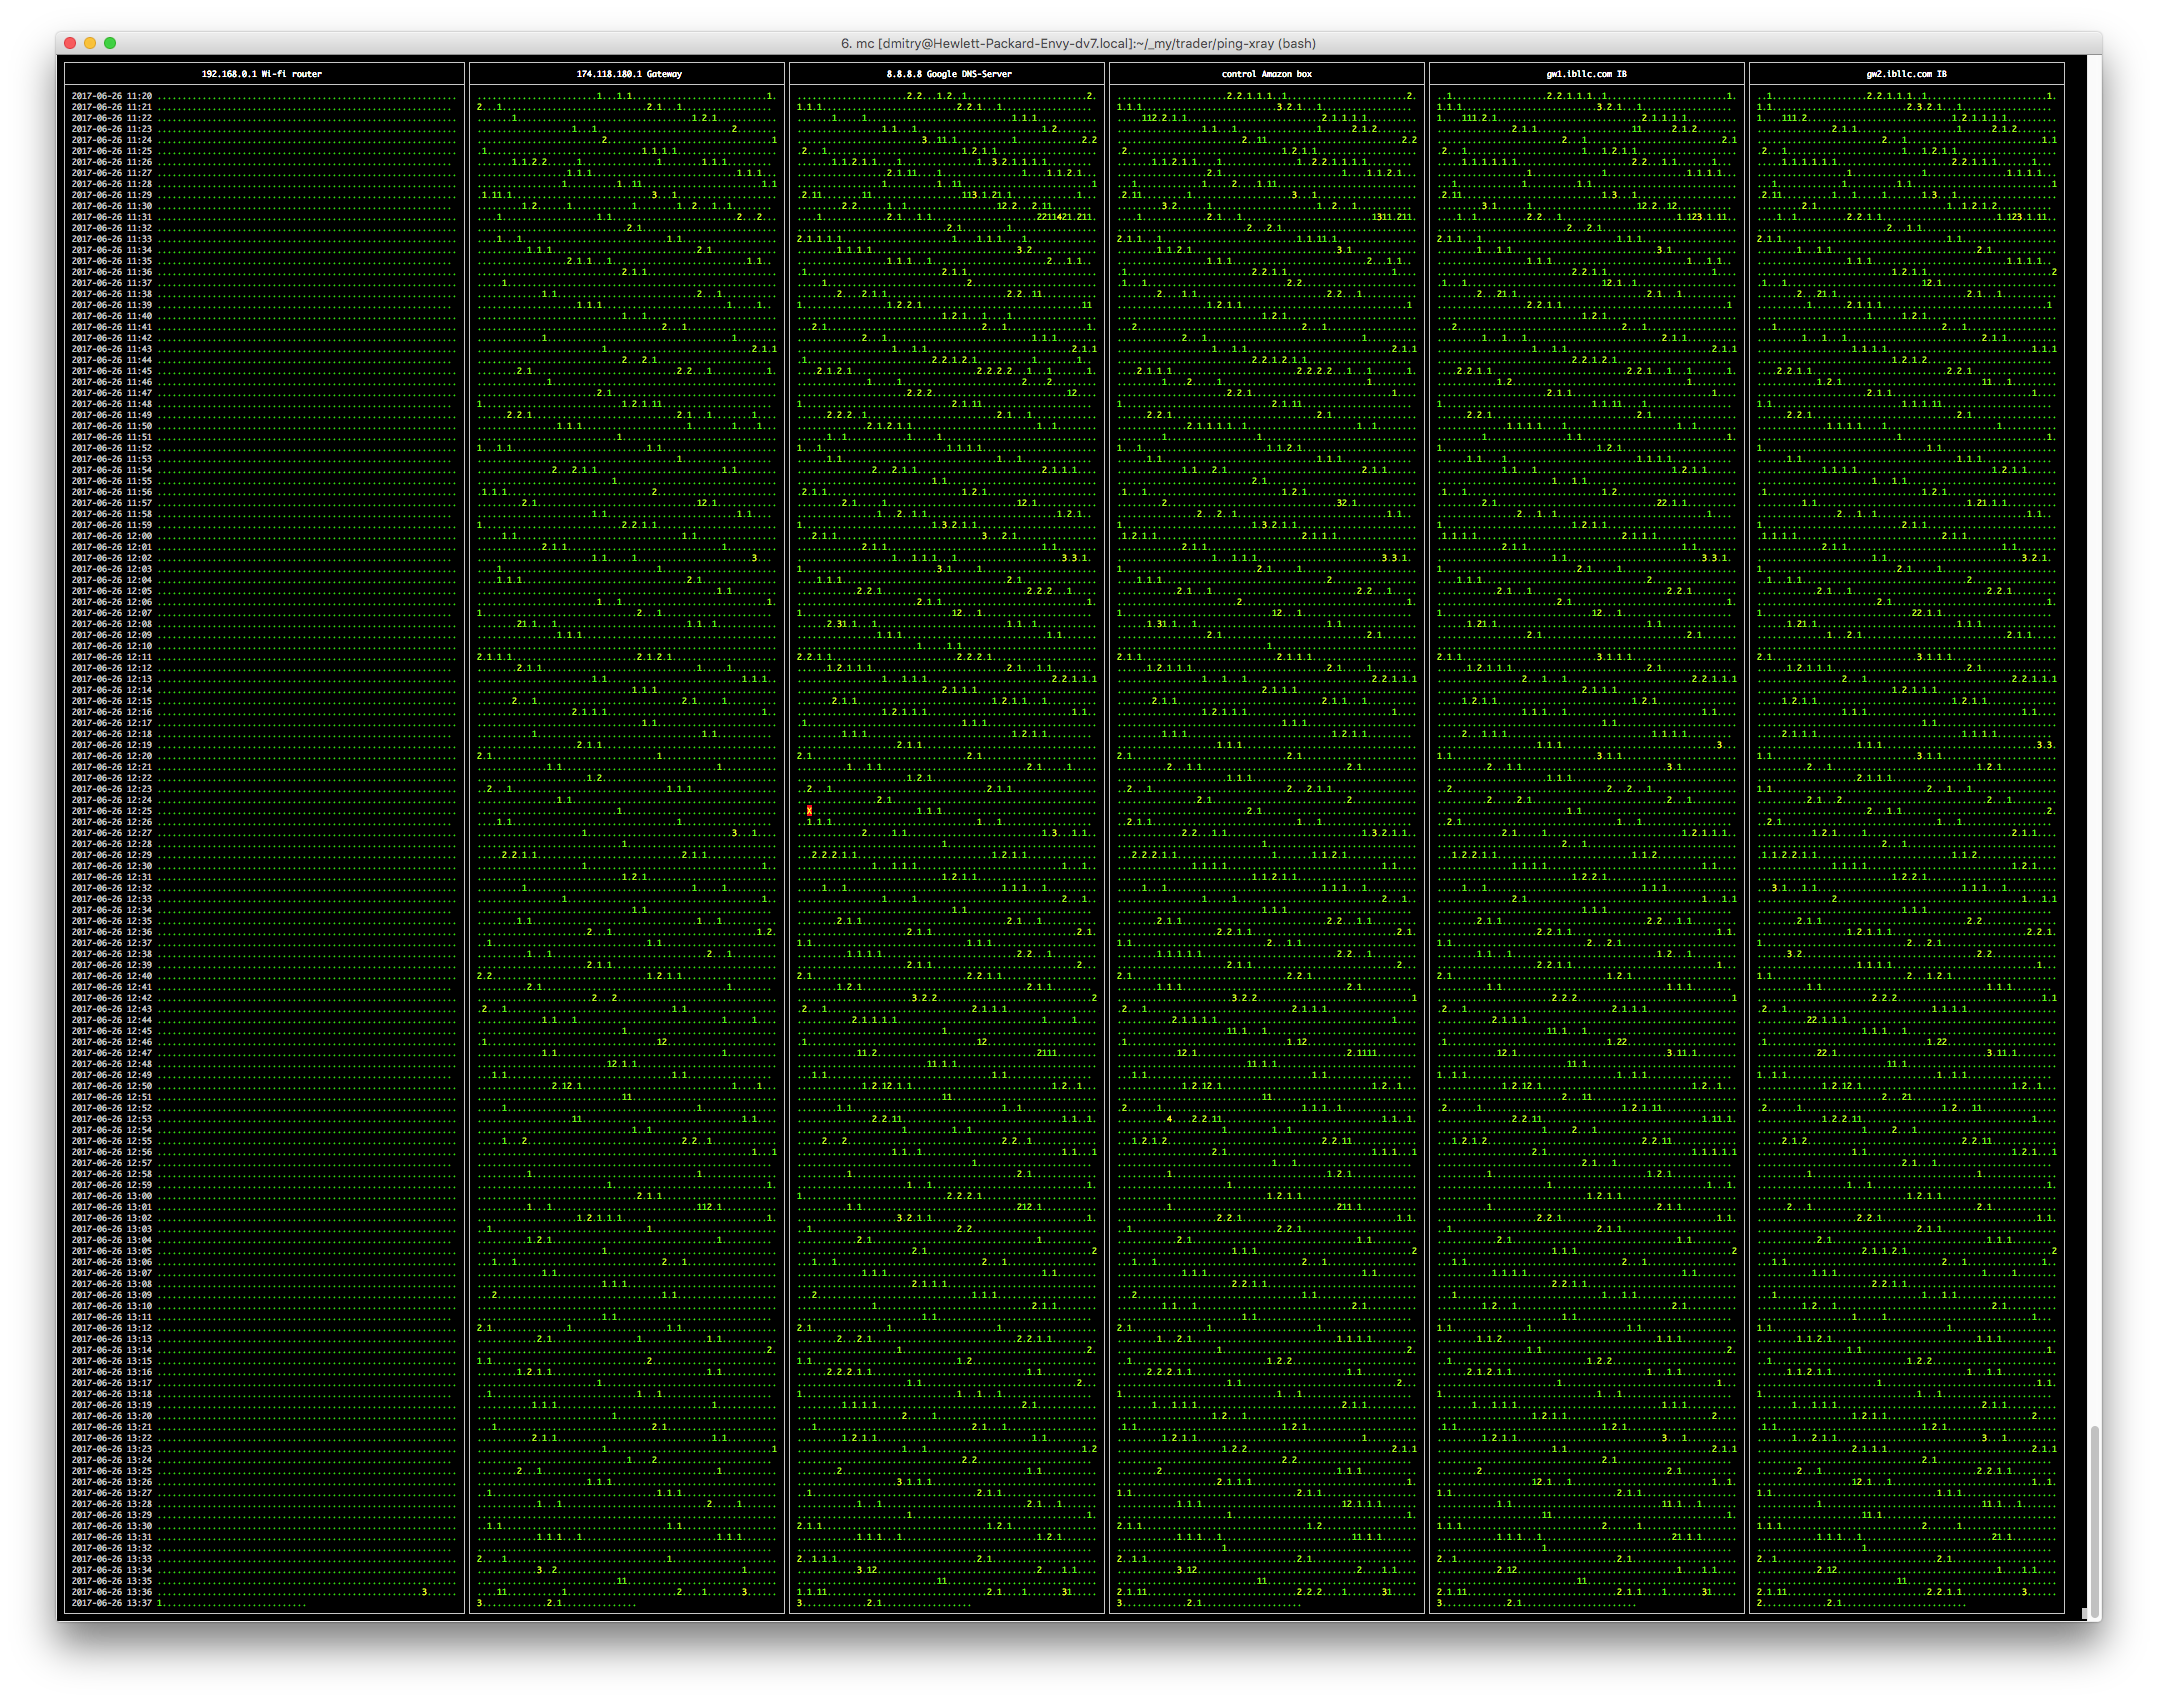
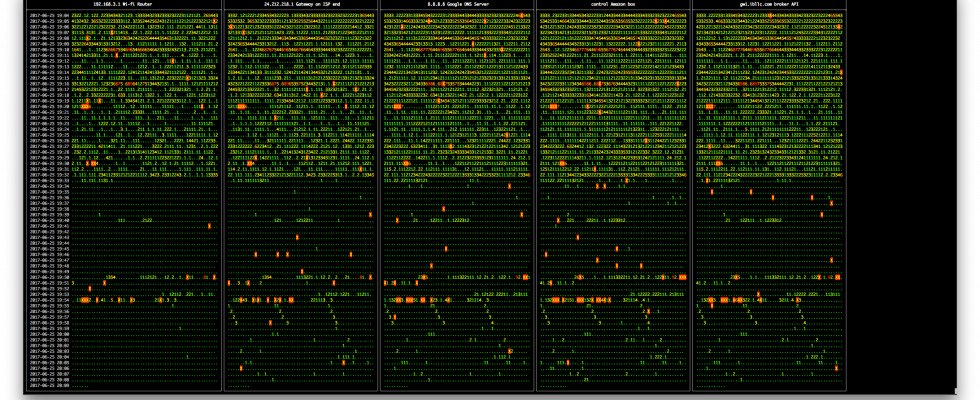
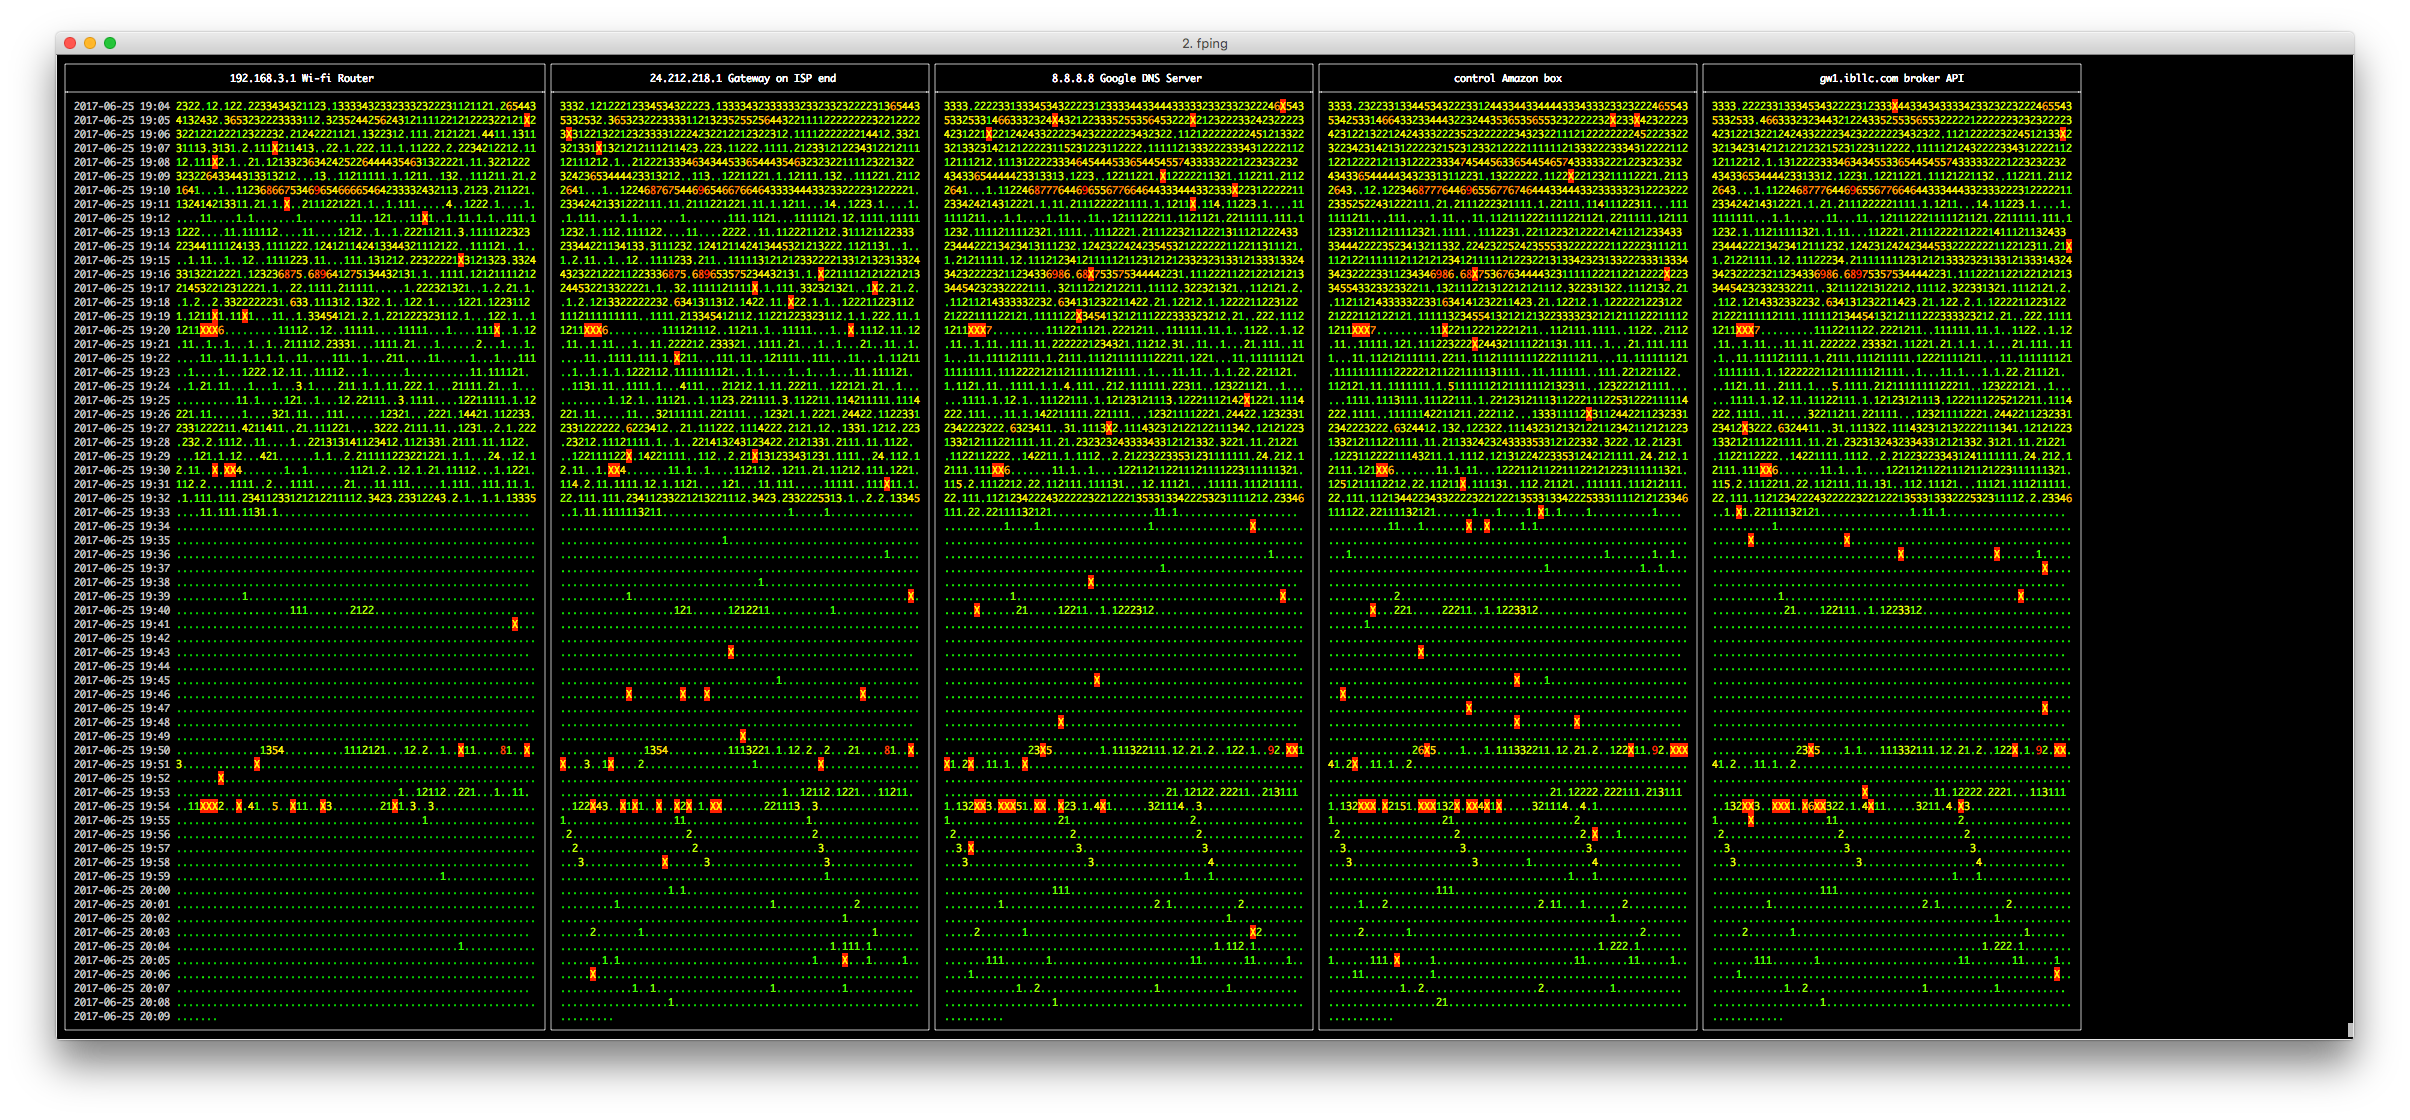
Quiet day in the office, left to right we ping: wifi router, gateway, Google DNS (anycast), some Amazon EC2 box, two Interactive Broker’s API Servers. One terminal window shows 2 hours 17 minutes of 1 second resolution pings lined up for 6 targets!
Note 10 seconds “almost outage” started on ISP Gateway caused delays and packet loss for other targets.
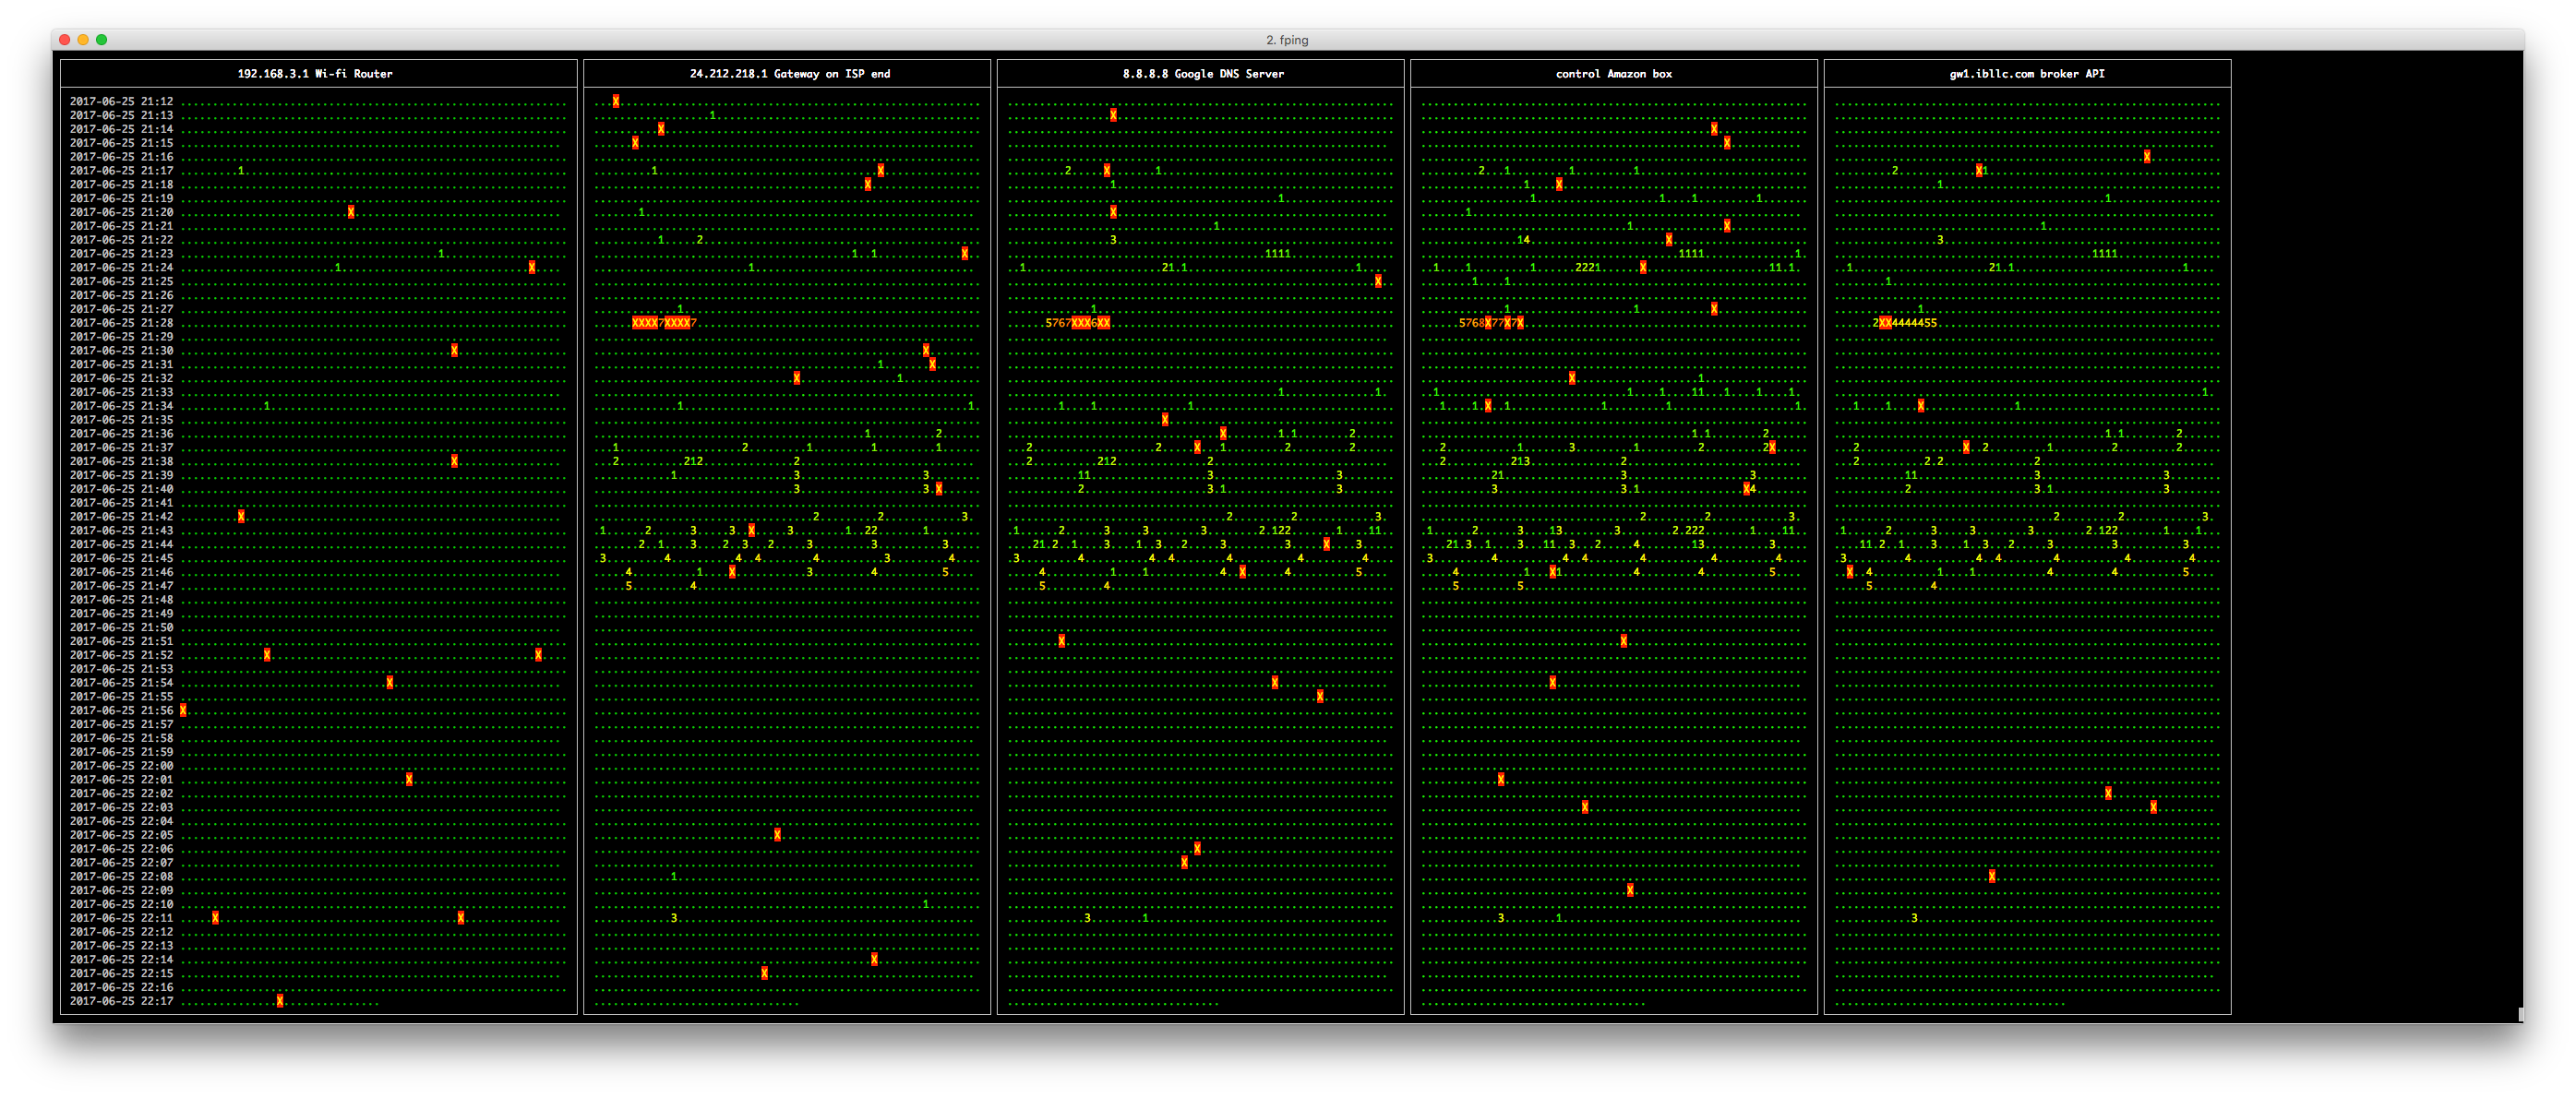
Note interesting artifacts: starting around 20:16 for 10 minutes we see distinct ICMP delays 3 times per minute (phasing slowly “to the right” since those periodic delays aren’t exact 60sec). What the blip are those?! How else you’d be able to see UFO flying around your network without this cool ping-xray tool??! 😉
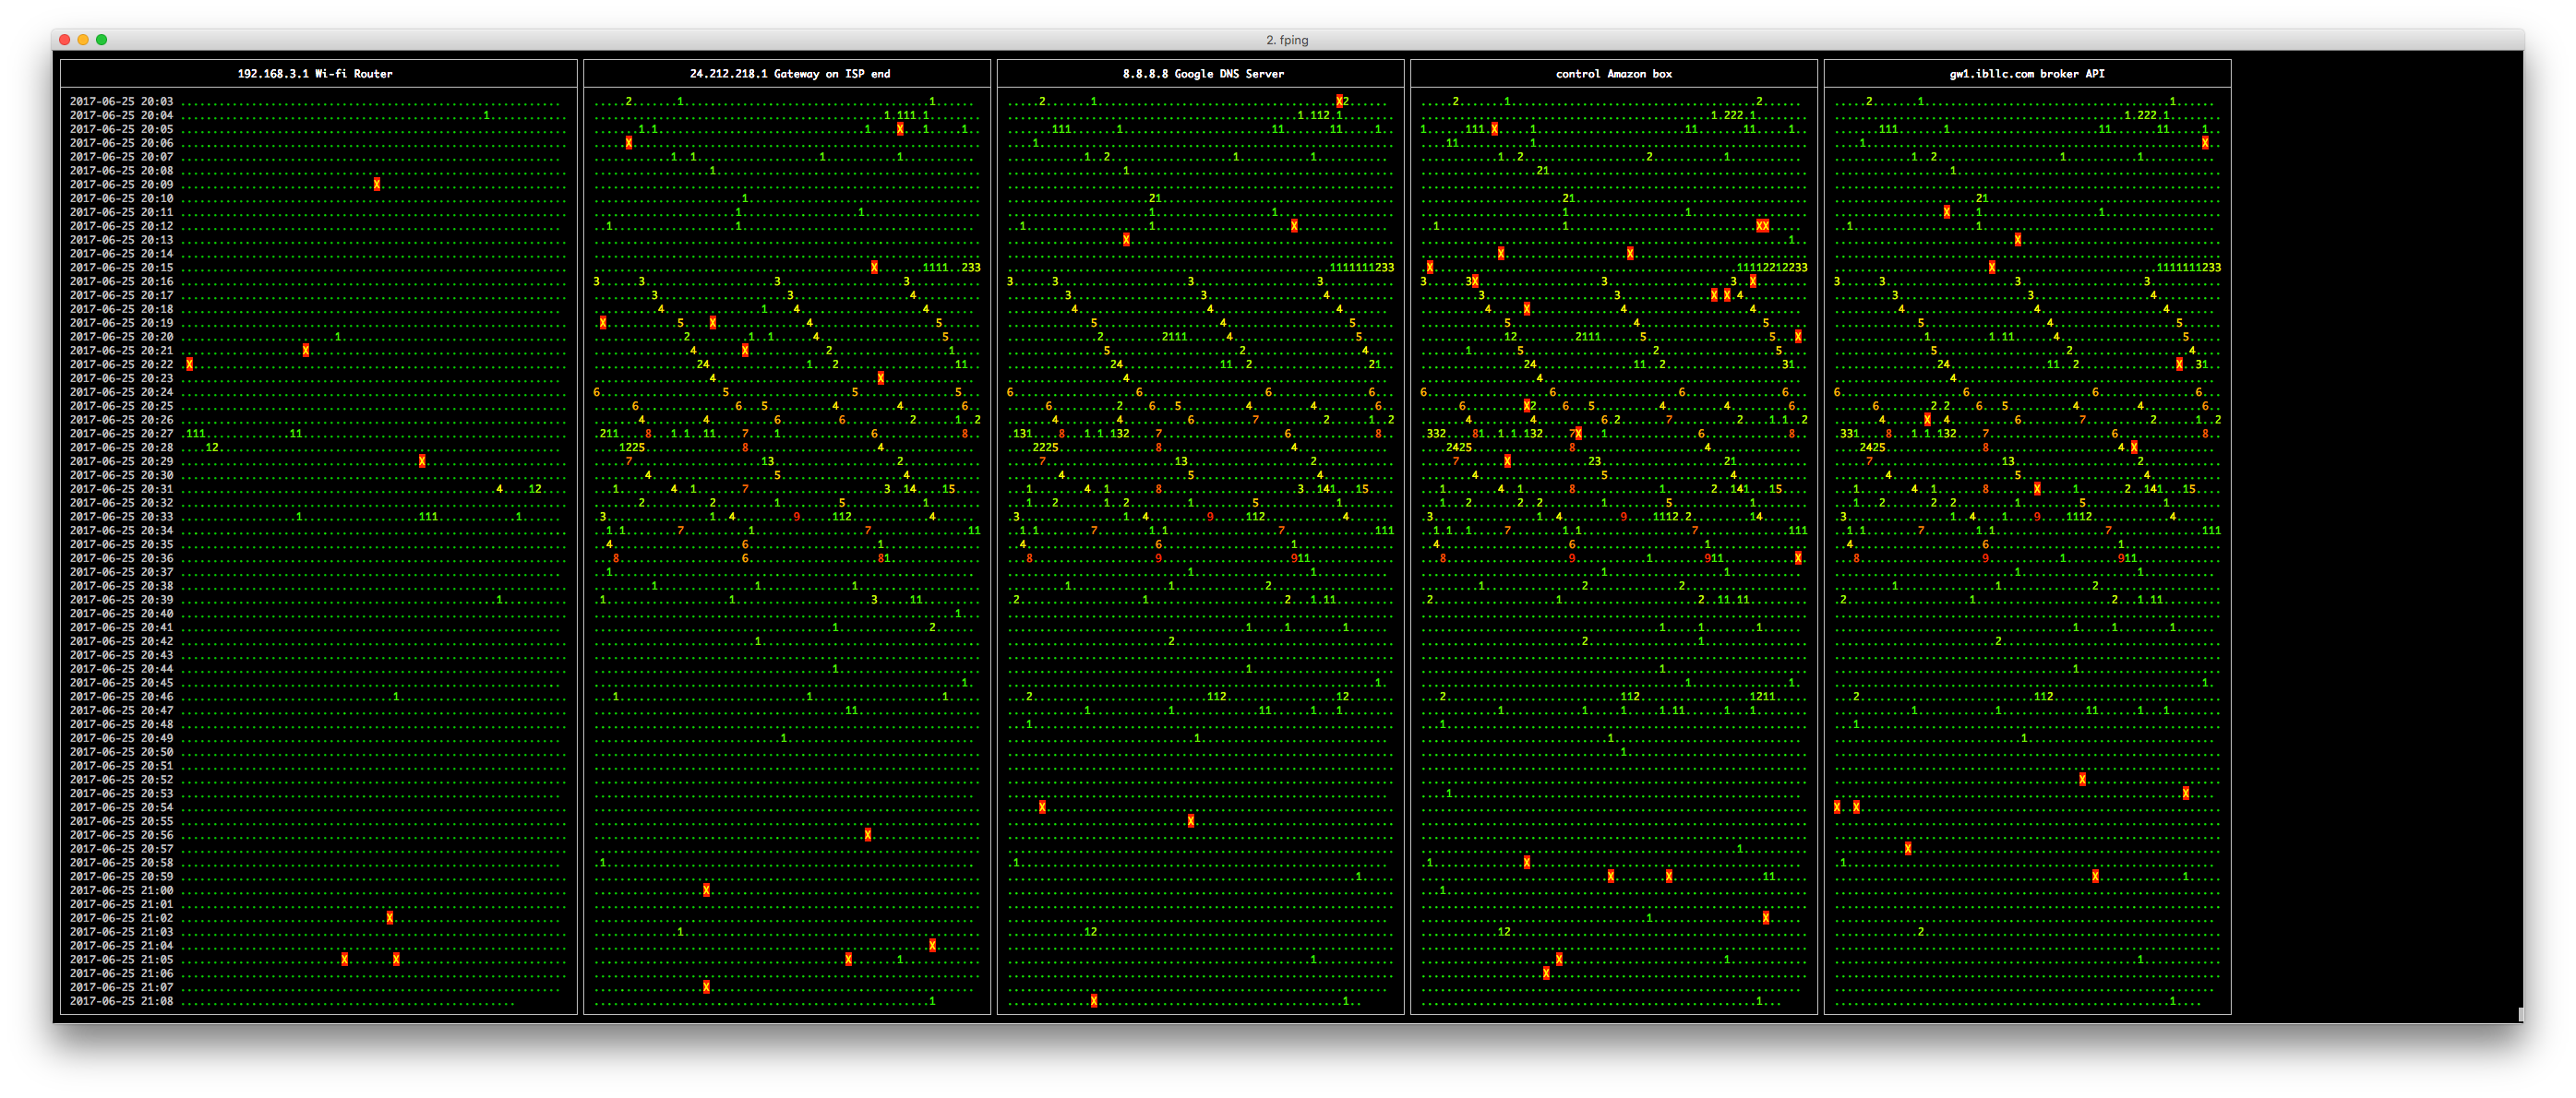
Artificially created high bandwidth traffic (by downloading couple movies same time in parallel with ping-xray running)
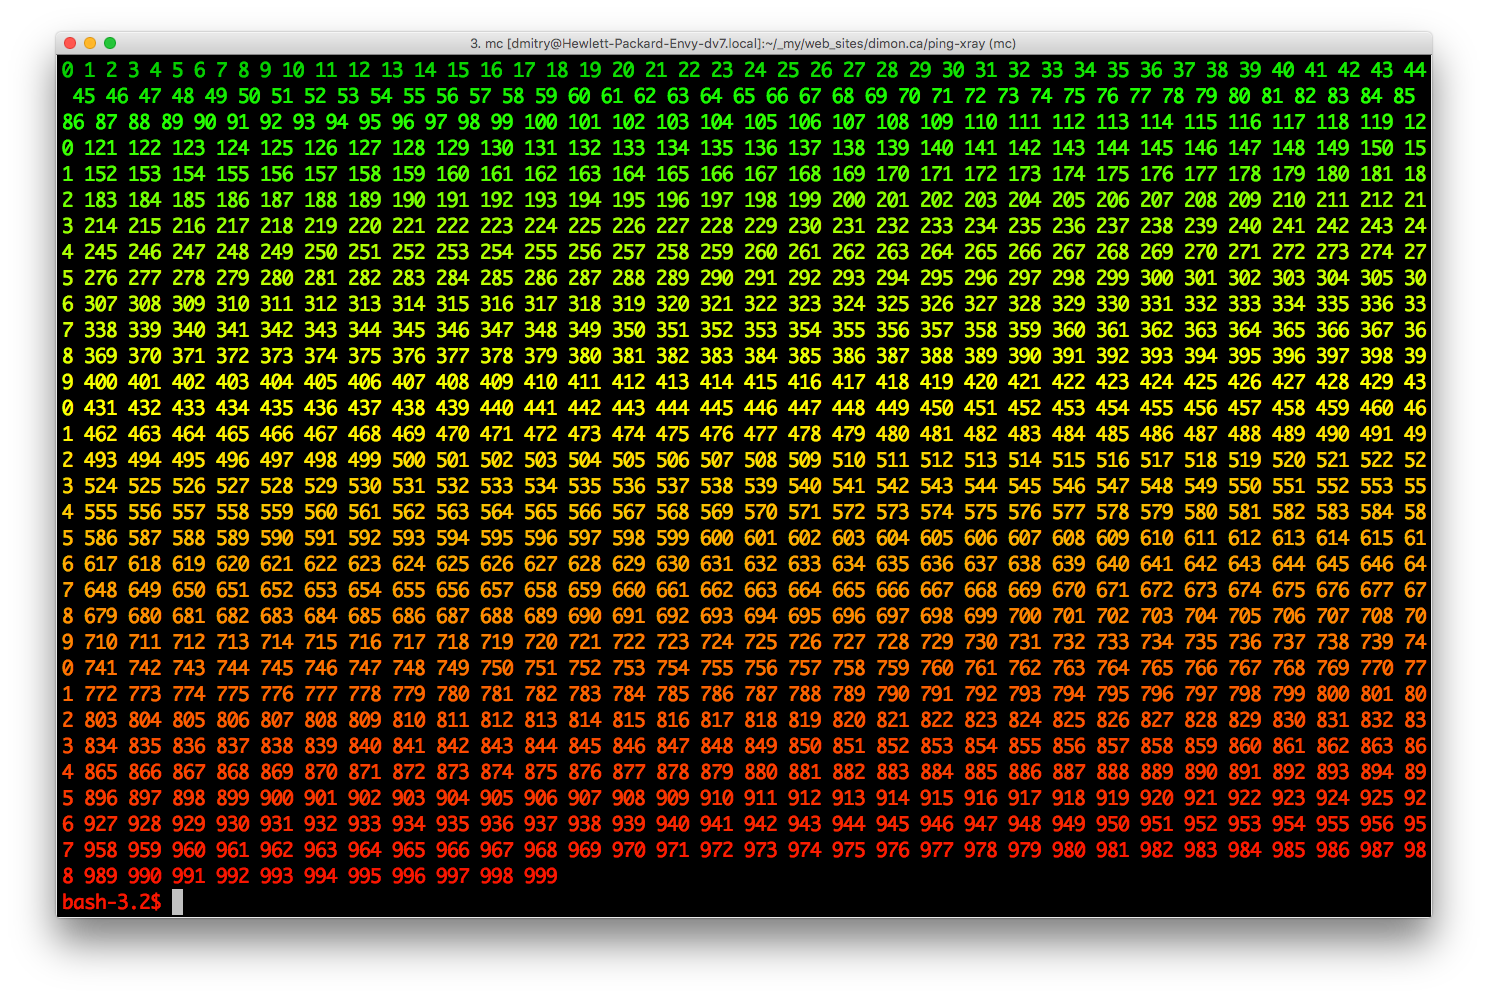
ping-xray uses custom made / unique colormap to make output more human-readable. Just by colour you might roughly see the Round-trip delay time!

Hex codes of RGB combinations for all of the ping-xray colormap values, you can find TXT version of the colormap here
 Pinger-XRay is here!-)

 Short description:

       Purpose: pingxer-xray is a monitoring tool, which facilitates sending ICMP "ping packets"
                to multiple targets (by using fping, which is the only dependency) and represent
                the results on one screen with couple hours of history to 5-8 targets with 1 sec
                resolution! Note: pinger-xray sends small (12 bytes payload) ICMP (type=8 ECHO)
                packets once a second, so it does not stress your network or servers.
    Dependency: fping
                To install fping:
                  - Ubuntu: sudo apt install fping
                  - Mac OS-X: brew insall fping
                    (if you use awesome Homebrew package management - https://brew.sh/ )
 Supported OSs: Linux & OS-X

      Download: https://github.com/shevkoplyas/ping-xray
                https://dimon.ca/ping-xray


  For feedback: https://github.com/shevkoplyas/ping-xray/issues
                or emai1 me: shevkoplyas at gmail dot com. Please report bugs/improvements/etc.

 (c) dimon.ca

 -----------------------------------------------------

 Description:

 Often we have questions about quality of our internet, especially when trading.
 When something seems to be not working right it is really hard to pinpoint which
 one particular wheel is squeaking in your setup especially when we have so many
 moving parts!

 What if your LAN is failing you (too much noise on wifi? faulty ethernet
 cables? bandwidth problems? etc.)
 Or what if your ISP experience rush hours and is too busy with folks streaming
 too many movies and just throttling your connection? Or what if you internet
 is just fine, but broker's server/link is stressed out?

 After the fact you might start asking support people here and there, but without any
 proofs on your hands they will be just pointing fingers to each other and bad weather
 or some other "mysterious" BS.

 And here comes the ping-xray, which allows you to:
	- ping multiple targets simultaneously
	- visually see the output with 1 second resolution
	  (one terminlal can show 2-3 hours history for lots of target hosts)!
	- create log files with unique filename, so you have it for the record.
	  (log file would have timestamp in it's name, so it is safe to restart the tool
	   without loosing any of the previus data)
	- create one CSV file with all targets exact round-trip delay time (exact milliseconds)

 ping-xray comes in two flaivors:
	- ping-xray-simple
	- ping-xray (fancy ascii "gui")

 First tool "ping-xray-simple" is just couple hundred lines of code script, which takes
 arbitrary number of targets to poing (IP or hostnames with optional description, see example below),
 and it pings them every N seconds (by default once per second) untill you stop it.

 For example if you run:
    ./ping-xray-simple 192.168.3.1 24.212.218.1 8.8.8.8 google.com gw1.ibllc.com gw2.ibllc.com

 Pinger creates 'ping-xray-output/' folder and writes logs: one log file per target plus one
 CSV file with Round-trip delay time (milliseconds) for all targets (one line = one second).
 Here's an example output of ping-xray-simple, which shows you last few lines of monitored.
 Basically it is trying to tail all created files and share the available screen lines equally:

  ==> 20170622_00_28_03.csv <==
  1498106030,2.18,21.5,68.1,32.1,64.6,71.1
  1498106031,10.7,20.9,43.6,20.6,43.0,36.4
  1498106032,5.75,22.2,46.8,21.8,44.9,38.3
  1498106033,1.99,11.7,36.6,11.7,32.2,30.0
  1498106034,1.93,15.7,41.1,16.2,35.4,38.8

  ==> 20170622_00_28_03_192.168.3.1 <==
  2017-06-22 00:29 ................................1..1.......................
  2017-06-22 00:30 ............................................................
  2017-06-22 00:31 ......................................................X.....
  2017-06-22 00:32 ............................................................
  2017-06-22 00:33 ..................................................X....
  ==> 20170622_00_28_03_24.212.218.1 <==
  2017-06-22 00:29 ................................1.11..............1........
  2017-06-22 00:30 ..................................X.........................
  2017-06-22 00:31 ............................................................
  2017-06-22 00:32 ............................................................
  2017-06-22 00:33 .......................................................
  ==> 20170622_00_28_03_8.8.8.8 <==
  2017-06-22 00:29 ................................1112..............1........
  2017-06-22 00:30 ............................................................
  2017-06-22 00:31 ............................................................
  2017-06-22 00:32 ....................1.......................................
  2017-06-22 00:33 .......................................................
  ==> 20170622_00_28_03_google.com <==
  2017-06-22 00:29 ................................1.11..............1........
  2017-06-22 00:30 ............................................................
  2017-06-22 00:31 ..............................X.............................
  2017-06-22 00:32 ............................................................
  2017-06-22 00:33 .......................................................
  ==> 20170622_00_28_03_gw1.ibllc.com <==
  2017-06-22 00:29 ...................1............1111..............1........
  2017-06-22 00:30 ............................................................
  2017-06-22 00:31 ............................................................
  2017-06-22 00:32 ....................1............X..........................
  2017-06-22 00:33 .......................................................
  ==> 20170622_00_28_03_gw2.ibllc.com <==
  2017-06-22 00:29 ......X....X....................1111..............1........
  2017-06-22 00:30 ............................X...............................
  2017-06-22 00:31 ............................................................
  2017-06-22 00:32 ....................1.............................1.........
  2017-06-22 00:33 .......................................................

 , where "." - successfull PING reply received back in less than 100 ms,
         "1" - ping took 100-199ms
         "2" - ping took 200-299ms
         "3" - ping took 300-399ms, etc.
         "X" - failed to get PING reply (ICMP ECHO) from the target.

 The second offered tool is "ping-xray". It provides similar functionality to
 the "ping-xray-simple", but it uses "bash simple curses" to draw "windows" with
 all the results in one terminal window using special ASCII symbols for
 pseudo-graphics (lines, colours etc.)  If you resize your terminal window, you'll
 need to re-start the ping-xray (it does not catch the window size change dynamically yet).

 See screenshots: https://dimon.ca/ping-xray/

 When, for example, you see the degradation or "X" happening in all targets, including your router,
 then obviously there's no need to call to ISP or broker's support line and you need to find out
 what causing those problems on your end. ;)

 Usually I'd recommend to run the pinger for the whole trading day and ping at least 3 targets:
	1) your router (on your LAN)
	2) your ISP gateway (1st IP outside your lan on the ISP end)
	3) some more distant public targets, like google.com and your broker's server.

 If your broker (or other target server) does not allow ICMP, then you can use "TCP SYN Ping"
 with much less aggressive rate of you ping requests (ping-xray not yet supports TCP SYN Ping).
 Or alternatively you can check tcp-traceroute from you to your broker server and choose
 some other pingable target few hops away from your real target.

 Cheers,
 Dmitry Shevkoplyas